Tool Debugger Operator
The Tool Debugger operator is a utility for inspecting and debugging LOPs (Live Operator Primitives) tools. It discovers all tools from a specified sequence of operators and outputs their complete schemas in various formats, including detailed tables and raw JSON. This allows developers and users to verify that their tools are correctly defined and to understand the exact structure that will be passed to other systems like AI models.
Unlike interactive debugging tools, the Tool Debugger provides a comprehensive, bulk output of all tool schemas at once, making it ideal for validation and documentation purposes.
Reviewing Tool Schemas with Web Viewer
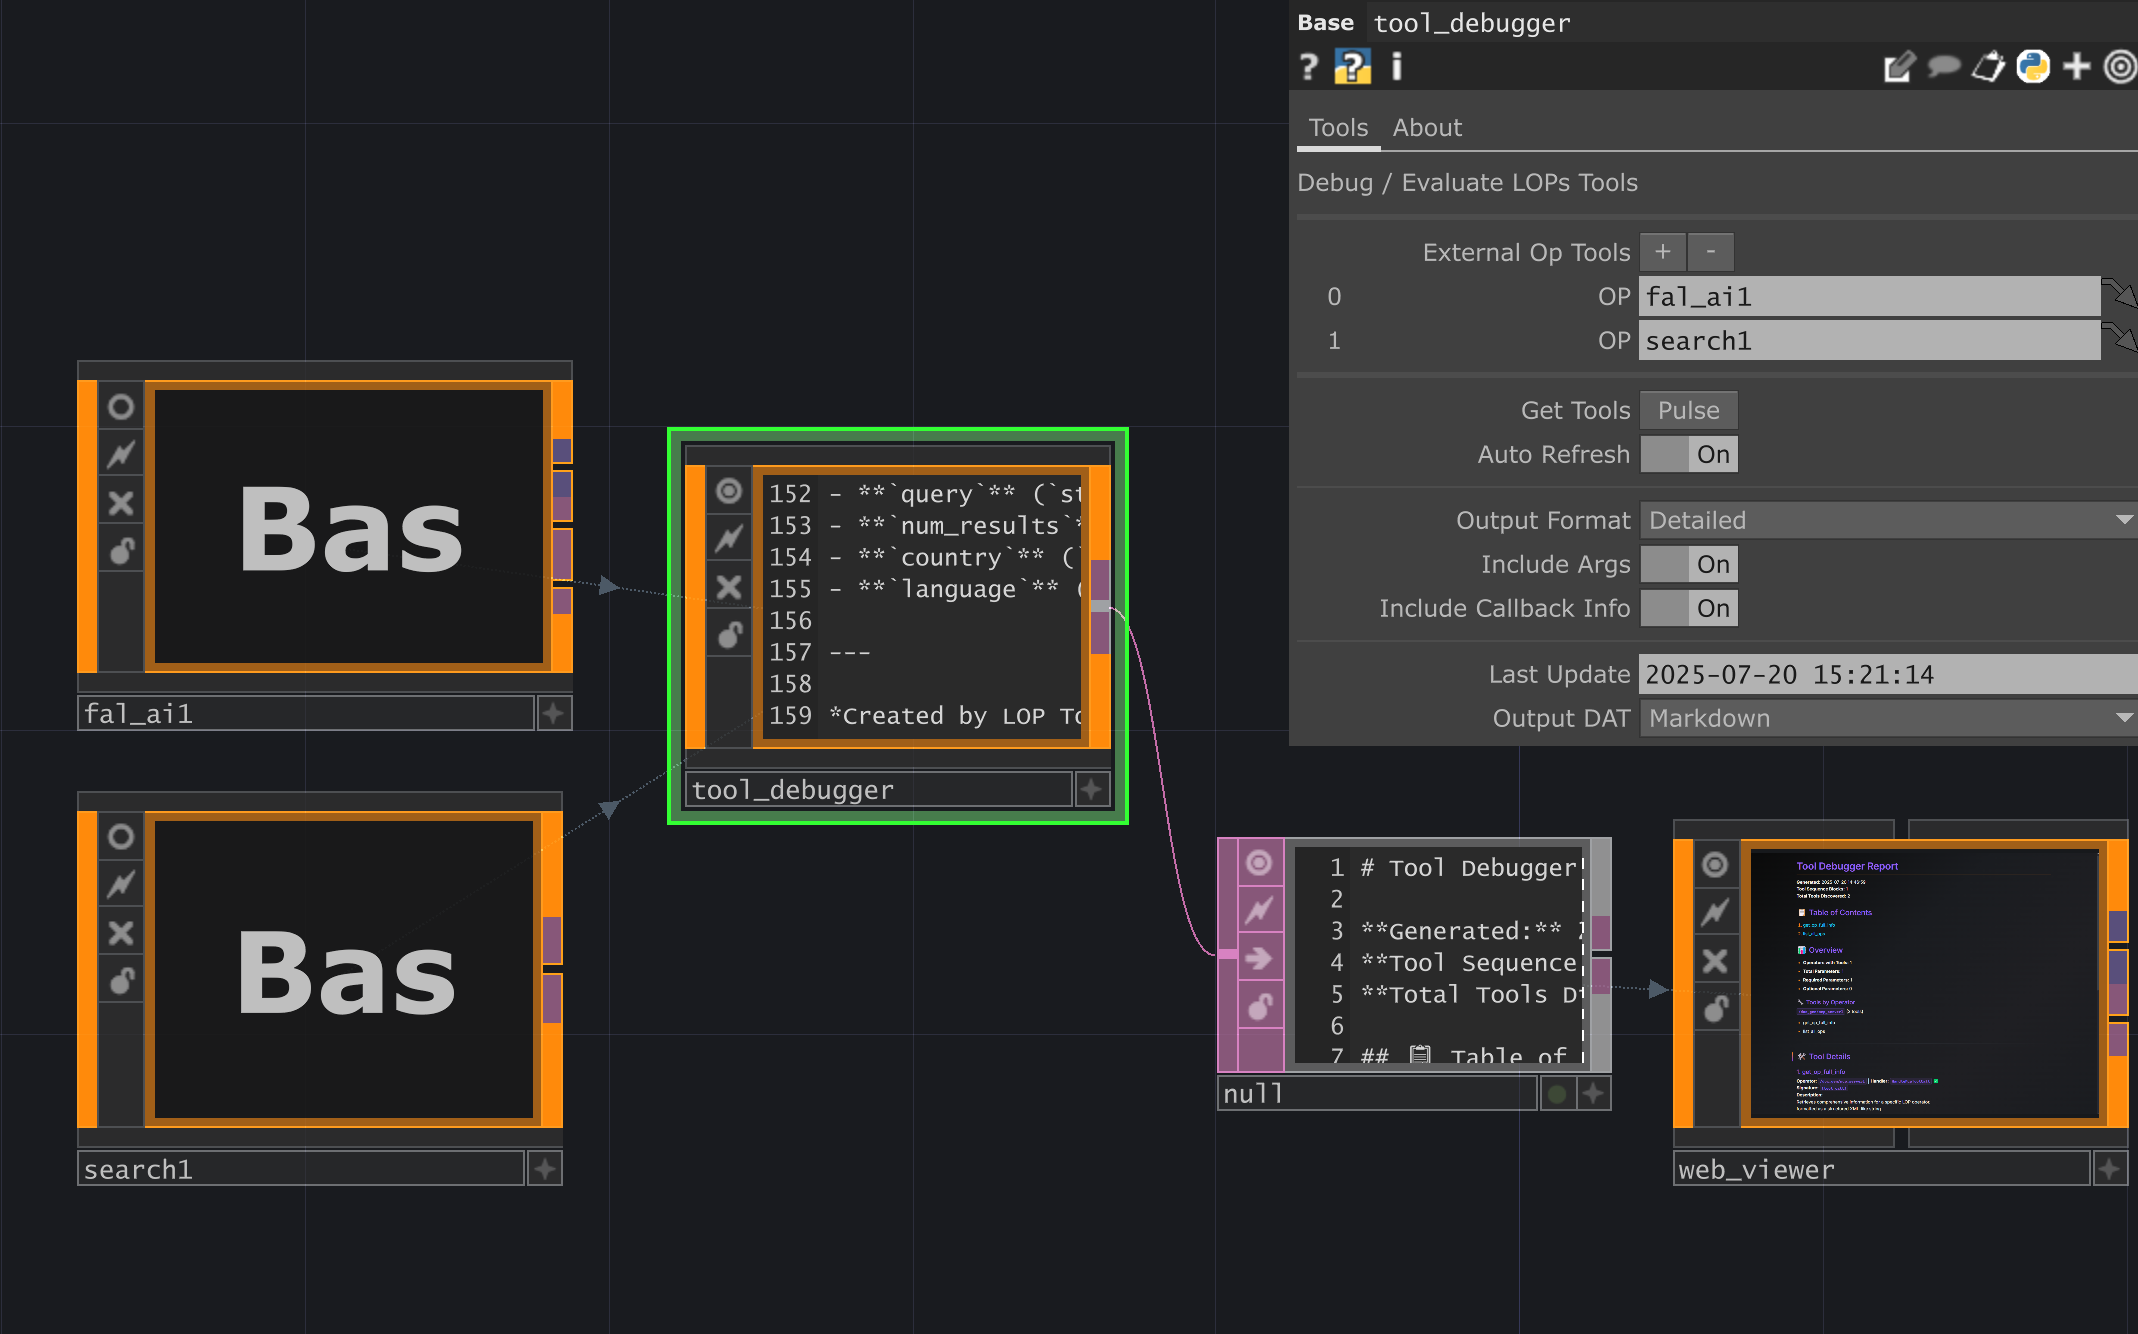
Section titled “Reviewing Tool Schemas with Web Viewer”A good workflow for reviewing tool schemas is to connect the mardown results from the Tool Debugger as the Markdown Source for a Web Viewer LOP and then pulse Render Markdown. This creates a nicely formatted view of your tool documentation right inside your TouchDesigner network.
Parameters
Section titled “Parameters”op('tool_debugger').par.Tool Sequence - Default:
None
op('tool_debugger').par.Tool0op OP - Default:
None
op('tool_debugger').par.Gettools Pulse - Default:
None
op('tool_debugger').par.Autorefresh Toggle - Default:
Off
op('tool_debugger').par.Includeargs Toggle - Default:
Off
op('tool_debugger').par.Includecallback Toggle - Default:
Off
op('tool_debugger').par.Lastupdate Str - Default:
"" (Empty String)
op('tool_debugger').par.Bypass Toggle - Default:
Off
op('tool_debugger').par.Showbuiltin Toggle - Default:
Off
op('tool_debugger').par.Version Str - Default:
"" (Empty String)
op('tool_debugger').par.Lastupdated Str - Default:
"" (Empty String)
op('tool_debugger').par.Creator Str - Default:
"" (Empty String)
op('tool_debugger').par.Website Str - Default:
"" (Empty String)
op('tool_debugger').par.Chattd OP - Default:
"" (Empty String)
Usage Examples
Section titled “Usage Examples”Basic Tool Inspection
Section titled “Basic Tool Inspection”- Create a
Tool Debuggeroperator. - Create an operator that has a
GetToolmethod (e.g., aTool Registryor a custom component). - In the
Tool Debugger’s “Tools” parameter page, drag the custom tool operator onto theOPfield within theExternal Op Toolssequence. - Click the
Get Toolspulse button. - Right-click on the
Tool Debuggerand select “View DATs” to see the generated outputs likemarkdownOutput,toolsTable, andparametersTable.
Verifying a Multi-Tool Operator
Section titled “Verifying a Multi-Tool Operator”Some operators, like MCP Client, can expose multiple tools at once. The Tool Debugger can be used to verify all of them are being exposed correctly.
- Connect the
Tool Debuggeras described above, pointing it to anMCP Clientoperator. - After pulsing
Get Tools, view thetoolsTableDAT. You will see a list of all tools provided by the client, each with a “Multi” type. - View the
markdownOutputDAT for a comprehensive, easy-to-read report of every tool, its parameters, and its handler information. This is useful for pasting into documentation or sharing with team members.